
Boosting QSR Operational Efficiency with an Actionable Insights Dashboard
QSR | UX-UI
Problem Statement
QSR businesses operate in a highly competitive environment where real-time decision-making is crucial for success. Restaurant managers and executives need immediate access to critical performance metrics to optimize operations, identify trends, and make data-driven decisions that directly impact profitability . The challenge was to create a unified dashboard that consolidates complex sales data from multiple sources into an intuitive, actionable interface.
Role & Responsibilities
As the UI/UX Designer for the Retail Operation Application, I played a central role in shaping the user experience for a business-critical dashboard used by multiple managerial stakeholders. This project aimed to streamline backend operations and provide real-time actionable insights through a configurable, transaction-based system, tailored to the unique needs and pain points of store-level business users
Discovery & Research
Discovery happened just after kickoff meeting with the key business member & project stakeholders where I gathered information about business goals, Users Type & their activities, about project success criteria, Timeline. Business team walkthrough us about the BRD which they have documented. After the discovery sessions I went through all documented material and setup meeting with BA & PM to align requirements. Then I setup meeting with key business & store heads, and support staff to understand their workflows, pain-points. These collaborative sessions was focused on:
-
Deep-diving into daily workflows, pain points, and current obstacles in store operations.
-
Identifying key performance indicators (KPIs) such as inventory accuracy, staff scheduling, issue resolution time, and promotional effectiveness.
-
Gathering feedback on limitations of previous systems, leading to a unified problem set for the dashboard.

Define
-
Articulated specific outcomes from the customer workshops, documenting operational goals and technical requirements.
-
Developed detailed user journeys for each role, highlighting workflow bottlenecks and key data touchpoints.
-
Created personas to represent typical users at each managerial level.
-
Designed site maps to organize dashboard modules logically according to both business priorities and user accessibility needs.
Primary Users:
-
Regional Managers
-
Operations Heads
-
Store Managers
Pain Points Identified:
-
Difficulty in tracking sales and orders across multiple stores.
-
Lack of visibility into channel-wise and source-wise performance.
-
Time-consuming manual comparisons of current and historical data.
User Needs:
-
Real-time insights on sales and orders.
-
Comparative performance indicators (e.g., vs. last week).
-
Quick drill-down filters for region, store, and channel.

Ideate & Prototype
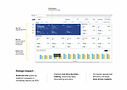
Solution 1: Realtime Insightful Dashboard
User Need : Regional managers need a single source of truth that provides actionable insights to make quick decisions, improve sales, and optimize operational efficiency.

User Need : User want a capabilities within system to configure alert on KPI level to real time notification.
Solution 2 : Alert configuration
Centralized Monitoring – KPI setup and alert configuration in one system ensures accurate tracking and quick detection of performance issues.
Proactive Communication – Automated alerts with escalation levels and targeted channels enable faster response to critical events.
Improved Efficiency – Consistent design and rule-based automation reduce manual monitoring and enhance decision-making speed.

Admin user want a capabilities within system to configure alert on any KPI level to real time notification.
Solution 3 : User Management

Evaluation & Results
Prototypes were shared in follow-up evaluation sessions for direct user feedback, ensuring user needs were met. efficiency, decision-making speed, and store performance visibility.
Incorporated stakeholder input to refine navigation, improve visual clarity, and ensure rapid access to actionable insights.

Result
The final system streamlined issue resolution, improved inventory accuracy, enabled real-time monitoring, and empowered all managerial roles via a unified dashboard.